
Meine netzwerkfähige APC Smart-UPS möchte ich jetzt auch mit Grafana überwachen.
Telegraf sammelt per snmp die Performancedaten der APC USV und speichert sie in einer InfluxDB Datenbank. Mein Setup:
- TIG-Stack mit Debian 10
- APC Smart-UPS 1000 mit AP9630 Network Management Card
System vorbereiten
Für das Paket snmp-mibs-downloader muss zuerst noch die non-free Repository in der /etc/apt/sources.list aktiviert werden.
# non-free Repository
deb http://deb.debian.org/debian buster main contrib non-free
deb-src http://deb.debian.org/debian buster main contrib non-free

deb http://security.debian.org/debian-security/ buster/updates main contrib non-free
deb-src http://security.debian.org/debian-security/ buster/updates main contrib non-free

deb http://deb.debian.org/debian buster-updates main contrib non-free
deb-src http://deb.debian.org/debian buster-updates main contrib non-free
Paketquellen aktualisieren und die zwei Pakete installieren.
apt-get update
apt install -y snmp snmp-mibs-downloader
Die PowerNET-MIB von APC wird noch benötigt. Die heruntergeladene Datei unter /usr/share/snmp/mibs/ als PowerNet-MIB speichern.
ls -l /usr/share/snmp/mibs/P*
-rw-r--r-- 1 root root 2588229 May  4 20:22 PowerNet-MIB
Telegraf konfigurieren
Für die APC USV wird eine eigene *.conf Datei erstellt: /etc/telegraf/telegraf.d/apc.conf
[[inputs.snmp]]
  agents = [ "192.168.25.8:161" ]    # IP Adresse mit snmp port der USV (Management Card)
  timeout = "30s"                    # timeout für jede snmp query
  retries = 3                        # retries innerhalb des timeout
  version = 2                        # snmp version
  name = "ups"                       # Measurement in der telegraf Datenbank
  community = "public"               # snmp community

[[inputs.snmp.field]]
  name = "hostname"
  oid = "RFC1213-MIB::sysName.0"
  is_tag = true

[[inputs.snmp.field]]
  name = "uptime"
  oid = "DISMAN-EXPRESSION-MIB::sysUpTimeInstance"

[[inputs.snmp.field]]
  name = "model"
  oid = "PowerNet-MIB::upsBasicIdentModel.0"

[[inputs.snmp.field]]
  name = "name"
  oid = "PowerNet-MIB::upsBasicIdentName.0"

[[inputs.snmp.field]]
  name = "upsBasicBatteryTimeOnBattery"
  oid = "PowerNet-MIB::upsBasicBatteryTimeOnBattery.0"

[[inputs.snmp.field]]
  name = "upsAdvBatteryRunTimeRemaining"
  oid = "PowerNet-MIB::upsAdvBatteryRunTimeRemaining.0"

[[inputs.snmp.field]]
  name = "upsAdvBatteryReplaceIndicator"
  oid = "PowerNet-MIB::upsAdvBatteryReplaceIndicator.0"

[[inputs.snmp.field]]
  name = "upsHighPrecBatteryCapacity"
  oid = "PowerNet-MIB::upsHighPrecBatteryCapacity.0"
  conversion = "float(1)"

[[inputs.snmp.field]]
  name = "upsHighPrecBatteryTemperature"
  oid = "PowerNet-MIB::upsHighPrecBatteryTemperature.0"
  conversion = "float(1)"

[[inputs.snmp.field]]
  name = "upsBasicOutputStatus"
  oid = "PowerNet-MIB::upsBasicOutputStatus.0"

[[inputs.snmp.field]]
  name = "upsHighPrecOutputLoad"
  oid = "PowerNet-MIB::upsHighPrecOutputLoad.0"
  conversion = "float(1)"

[[inputs.snmp.field]]
  name = "upsHighPrecOutputEfficiency"
  oid = "PowerNet-MIB::upsHighPrecOutputEfficiency.0"
  conversion = "float(1)"

[[inputs.snmp.field]]
  name = "upsHighPrecOutputVoltage"
  oid = "PowerNet-MIB::upsHighPrecOutputVoltage.0"
  conversion = "float(1)"

[[inputs.snmp.field]]
  name = "upsHighPrecInputLineVoltage"
  oid = "PowerNet-MIB::upsHighPrecInputLineVoltage.0"
  conversion = "float(1)"

[[inputs.snmp.field]]
  name = "upsHighPrecOutputCurrent"
  oid = "PowerNet-MIB::upsHighPrecOutputCurrent.0"
  conversion = "float(1)"

[[inputs.snmp.field]]
  name = "upsHighPrecOutputEnergyUsage"
  oid = "PowerNet-MIB::upsHighPrecOutputEnergyUsage.0"
  conversion = "float(1)"

# hab ich alle deaktiviert, denke die sind nicht nötig
#
# IF-MIB::ifTable contains counters on input and output traffic as well as errors and discards.
#[[inputs.snmp.table]]
#  name = "interface"
#  inherit_tags = [ "hostname" ]
#  oid = "IF-MIB::ifTable"

# Interface tag - used to identify interface in metrics database
#[[inputs.snmp.table.field]]
#  name = "ifDescr"
#  oid = "IF-MIB::ifDescr"
#  is_tag = true

# IF-MIB::ifXTable contains newer High Capacity (HC) counters that do not overflow as fast for a few of the ifTable counters
#[[inputs.snmp.table]]
#  name = "interface"
#  inherit_tags = [ "hostname" ]
#  oid = "IF-MIB::ifXTable"

# Interface tag - used to identify interface in metrics database
#[[inputs.snmp.table.field]]
#  name = "ifDescr"
#  oid = "IF-MIB::ifDescr"
#  is_tag = true

# EtherLike-MIB::dot3StatsTable contains detailed ethernet-level information about what kind of errors have been logged on an interface (such as FCS error, frame too long, etc)
#[[inputs.snmp.table]]
#  name = "interface"
#  inherit_tags = [ "hostname" ]
#  oid = "EtherLike-MIB::dot3StatsTable"

# Interface tag - used to identify interface in metrics database
#[[inputs.snmp.table.field]]
#  name = "ifDescr"
#  oid = "IF-MIB::ifDescr"
#  is_tag = true
Um zu überprüfen ob die Konfiguration auch funktioniert:
telegraf --config /etc/telegraf/telegraf.d/apc.conf --test
2019-05-30T14:46:46Z I! Starting Telegraf 1.10.4
> ups,agent_host=192.168.25.8,host=tig,hostname=usv model="Smart-UPS 1000",name="usv",upsAdvBatteryReplaceIndicator=1i, ...
> interface,agent_host=192.168.25.8,host=tig,hostname=usv,ifDescr=LOOPBACK,ifIndex=1 ifAdminStatus=1i,ifInDiscards=0i, ...
> interface,agent_host=192.168.25.8,host=tig,hostname=usv,ifDescr=vmac0,ifIndex=2 ifAdminStatus=1i,ifInDiscards=0i, ...
Den telegraf.service jetzt neu starten um die Änderungen zu aktivieren.
systemctl restart telegraf.service
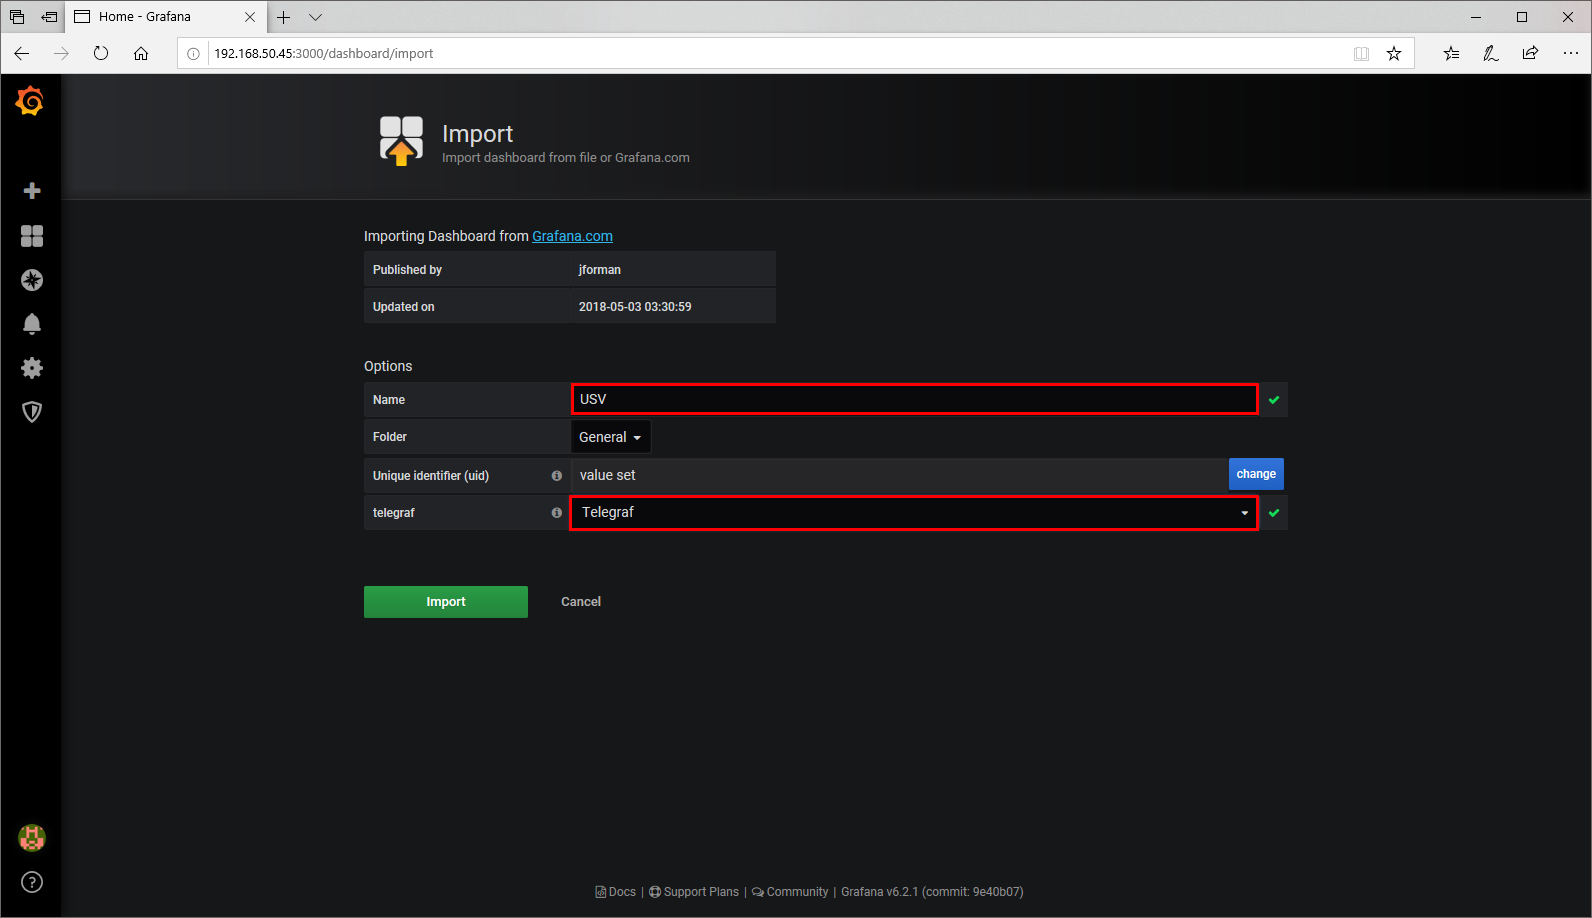
Grafana Dashboard für die USV erstellen
Dashboards → Manage → import → Grafana.com Dashboard: https://grafana.com/dashboards/5901 (UPS Dashboard von der Grafana Community)

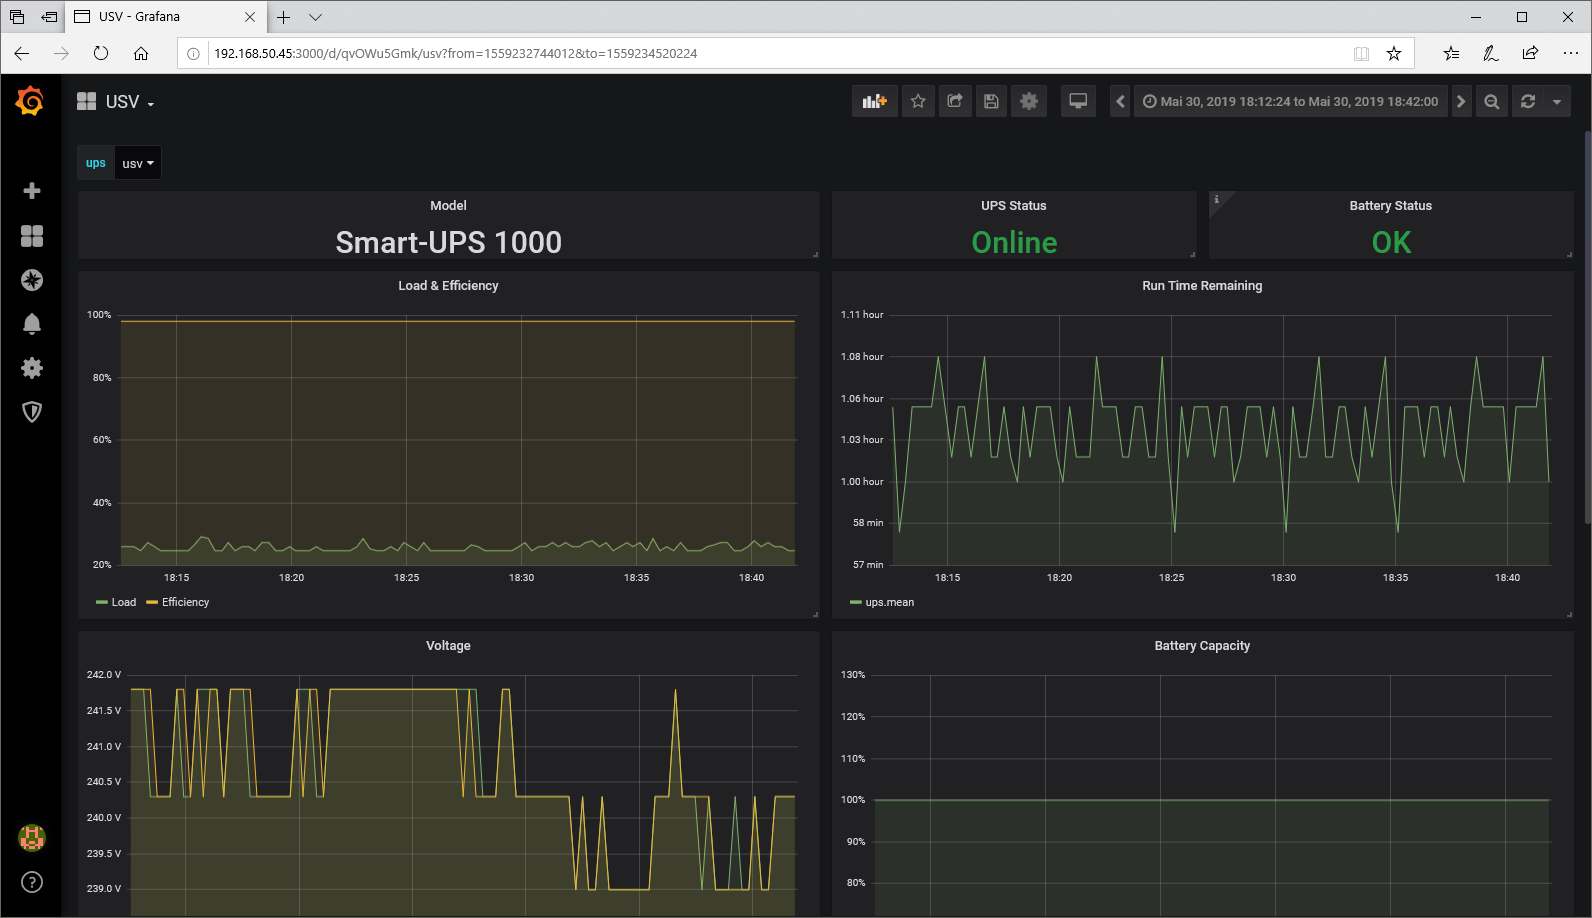
Das Dashboard funktioniert auf Anhieb.
Moin geht das auch über zabbix?
Eine USV Lässt sich auch mit Zabbix überwachen und grafisch darstellen, wenn du das meinst.